


Overview
In 2024, global ocean schedule reliability averaged just over 50% (Sea-Intelligence, reported by JOC).
At the same time, the highest-performing structured loops reached 98.4% reliability, with many shuttle services recording 100% on-time arrivals (Sea-Intelligence, reported by JOC, Feb 2025).
For heavy cargo importers, this gap isn’t theoretical — it is the difference between meeting a project deadline and absorbing a five-figure penalty.
Yet most procurement decisions still begin with a simple comparison of freight rates.
You’re importing 20' containers of granite from Rajasthan to Los Angeles.
Three ocean freight quotes land in your inbox:
Option A: $2,800 (Direct, 18 days)
Option B: $3,200 (Direct, 16 days)
Option C: $2,600 (Via transshipment, 22 days)
On paper, Option C appears reasonable — same container, same destination, lower rate.
But once the shipment moves, small differences compound quickly:
A missed transshipment adds seven days
Equipment constraints at Los Angeles add another five
The project deadline slips, triggering penalties that far exceed the $200 saved upfront
This is where most importers underestimate the gap between price and total risk.
What 1998 Didn’t Have to Worry About
A January 1998 Journal of Commerce (JOC) analysis showed freight executives prioritizing:
Rate competitiveness
Vessel capacity
Service frequency
Carrier alliances
What didn’t appear anywhere in the 1998 discussions?
Schedule reliability
Transshipment exposure
Equipment allocation
Total landed cost risk
Back then:
Most services were direct
On-time performance hovered around 75–80%
Variation across carriers was small
Reliability simply wasn’t a differentiator.
Today, everything has changed.
What 2024–2025 Data Shows Instead
According to Sea-Intelligence’s global tracking (reported by JOC, Dec 2024), industry-wide schedule reliability averaged just above 50% through the first ten months of 2024.
Meaning:
Half of all global containers missed their published arrival windows.
Meanwhile, advanced, intentionally structured loops began delivering dramatically different results:
Premium service designs consistently exceeded 90% on-time performance (JOC, 1H 2025).
A Sea-Intelligence analysis recorded 98.4% reliability on 15 shuttle services, with most achieving 100% on-time arrivals in February 2025 (JOC, Feb 2025).
Other service types—especially multi-stop or congestion-exposed networks—showed far lower consistency.
eeSea data (reported by JOC, Q1 2025) recorded certain loops performing in the low-20% to mid-30% range.
This is no longer a marginal gap.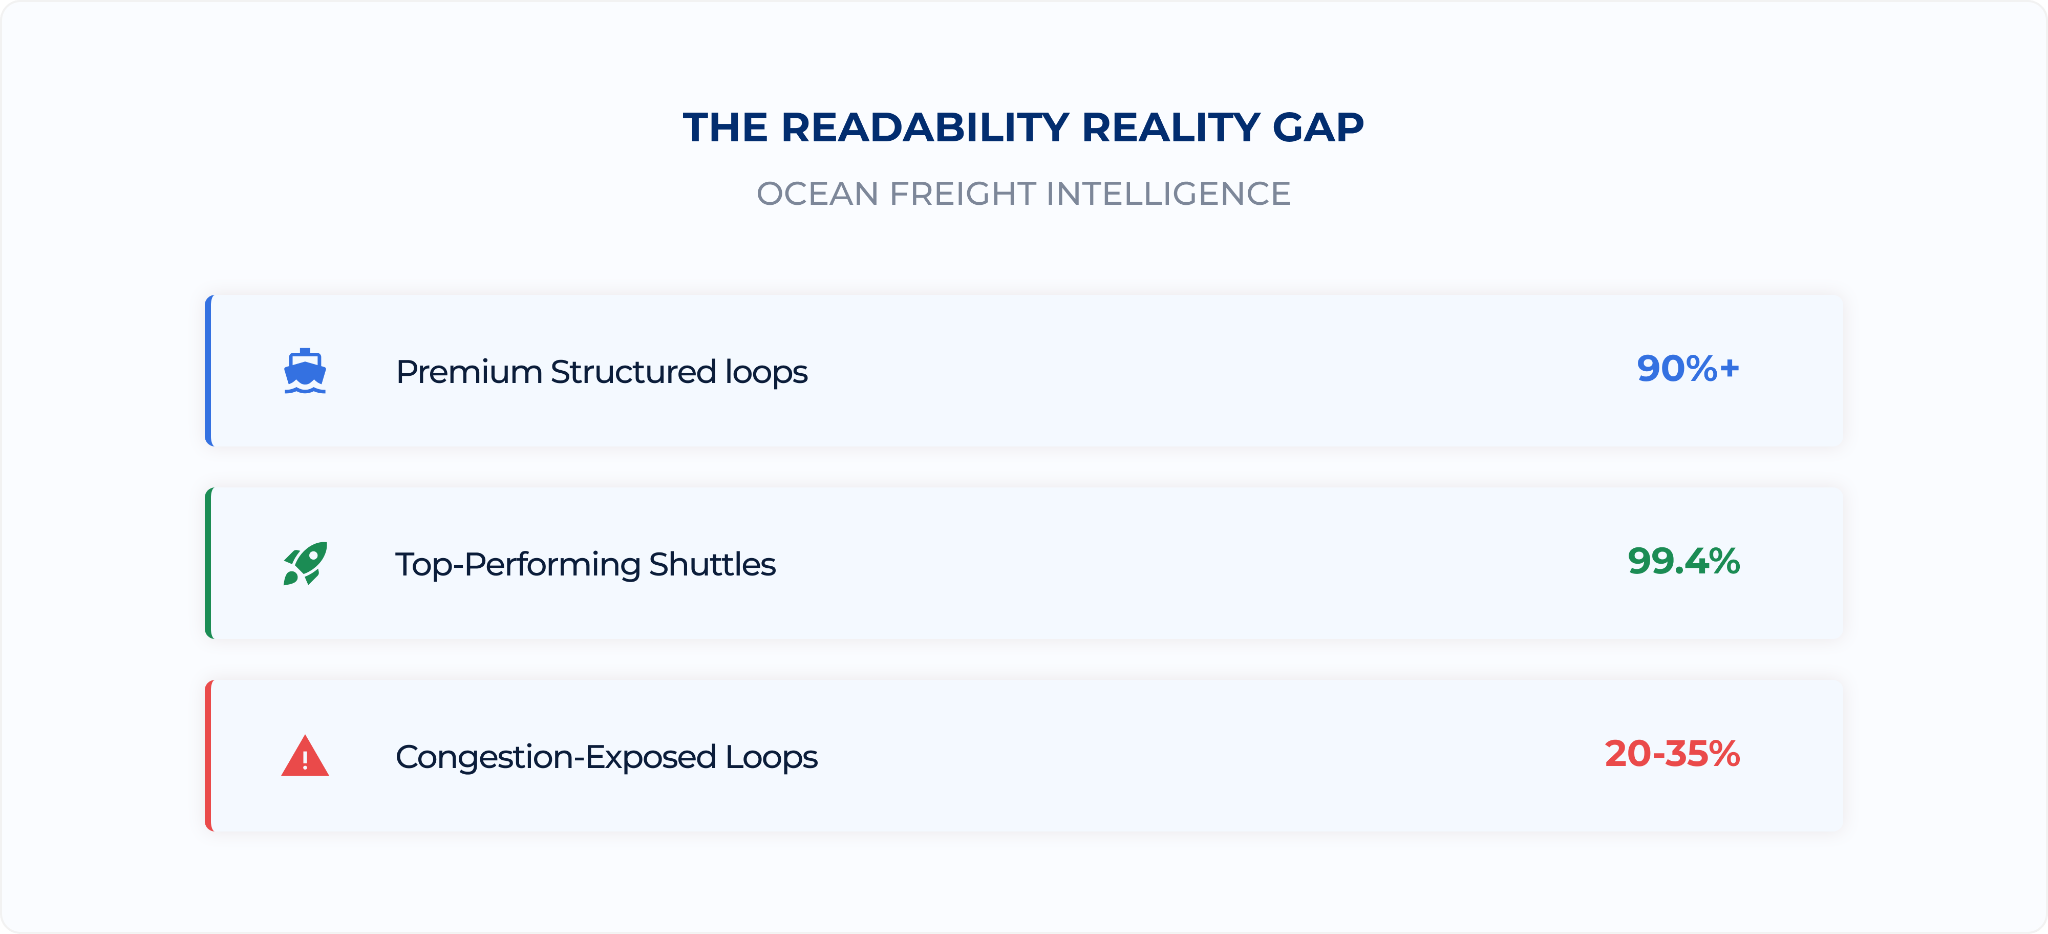
The Reliability Reality (2024–2025)
Highest-performing shuttle loops:
➡️ 98.4% (many at 100%)
Premium structured loops:
➡️ 90%+
Congestion-exposed / multi-stop loops:
➡️ 20–35%
Industry average:
➡️ ~50–55%
Source: Sea-Intelligence & eeSea, reported by Journal of Commerce (2024–2025)
Why Heavy Cargo Suffers the Most
Granite, marble, steel, machinery, and project cargo are:
Deadline-sensitive
Equipment-dependent
Handling-sensitive
Penalty-exposed
Sequence-critical
One missed connection or equipment shortage can trigger:
Idle installation crews
Customer penalties
Missed project milestones
Per diem
Storage and handling fees
A “cheap” rate can become the costliest choice in heavy cargo logistics.
The Five Hidden Costs Behind “Cheap” Freight
1. Transshipment Risk
Each extra touch point raises the odds of:
Missed connections
Vessel rollovers
Port dwell delays
Even a $200 cheaper rate can turn into a $15,000 penalty.
2. Equipment Availability at Destination
Heavy cargo relies on:
20' containers
20' chassis
Yard lifting capacity
Services differ in how deeply they stock equipment.
A vessel may arrive on time—but your cargo still gets stuck waiting for a chassis.
3. Congestion Dynamics
JOC reporting throughout 2024 showed severe pressure from:
Red Sea diversion impacts
Baked-in schedule disruptions
Reduced buffer capacity
Some premium loops secure consistent berthing windows. Others may wait longer offshore during peak congestion.
4. Reliability Variation Between Service Types
Based on eeSea & Sea-Intelligence performance ranges:
Some loops maintain 90%+
Some shuttle services reach near-100%
Others operate in the 20–35% range
This 60+ point spread is why the cheapest rate can produce the most expensive outcome.
5. Exception Handling When Delays Happen
When things slip, importers depend on:
Fast escalation
Rebooking transparency
Actual timeline updates
Delay cost often exceeds freight cost.
The Route Intelligence Framework
Leading importers evaluate risk first, rate last.
1. Route Architecture
Direct → Single transshipment → Multiple transshipments
Each transfer compounds the delay probability.
2. Equipment Allocation
Ask:
“How predictable is 20’ equipment availability at destination?”
“How is chassis allocation managed for heavy cargo?”
3. 90-Day Lane-Specific Reliability
Global averages mean nothing.
Your lane data is everything.
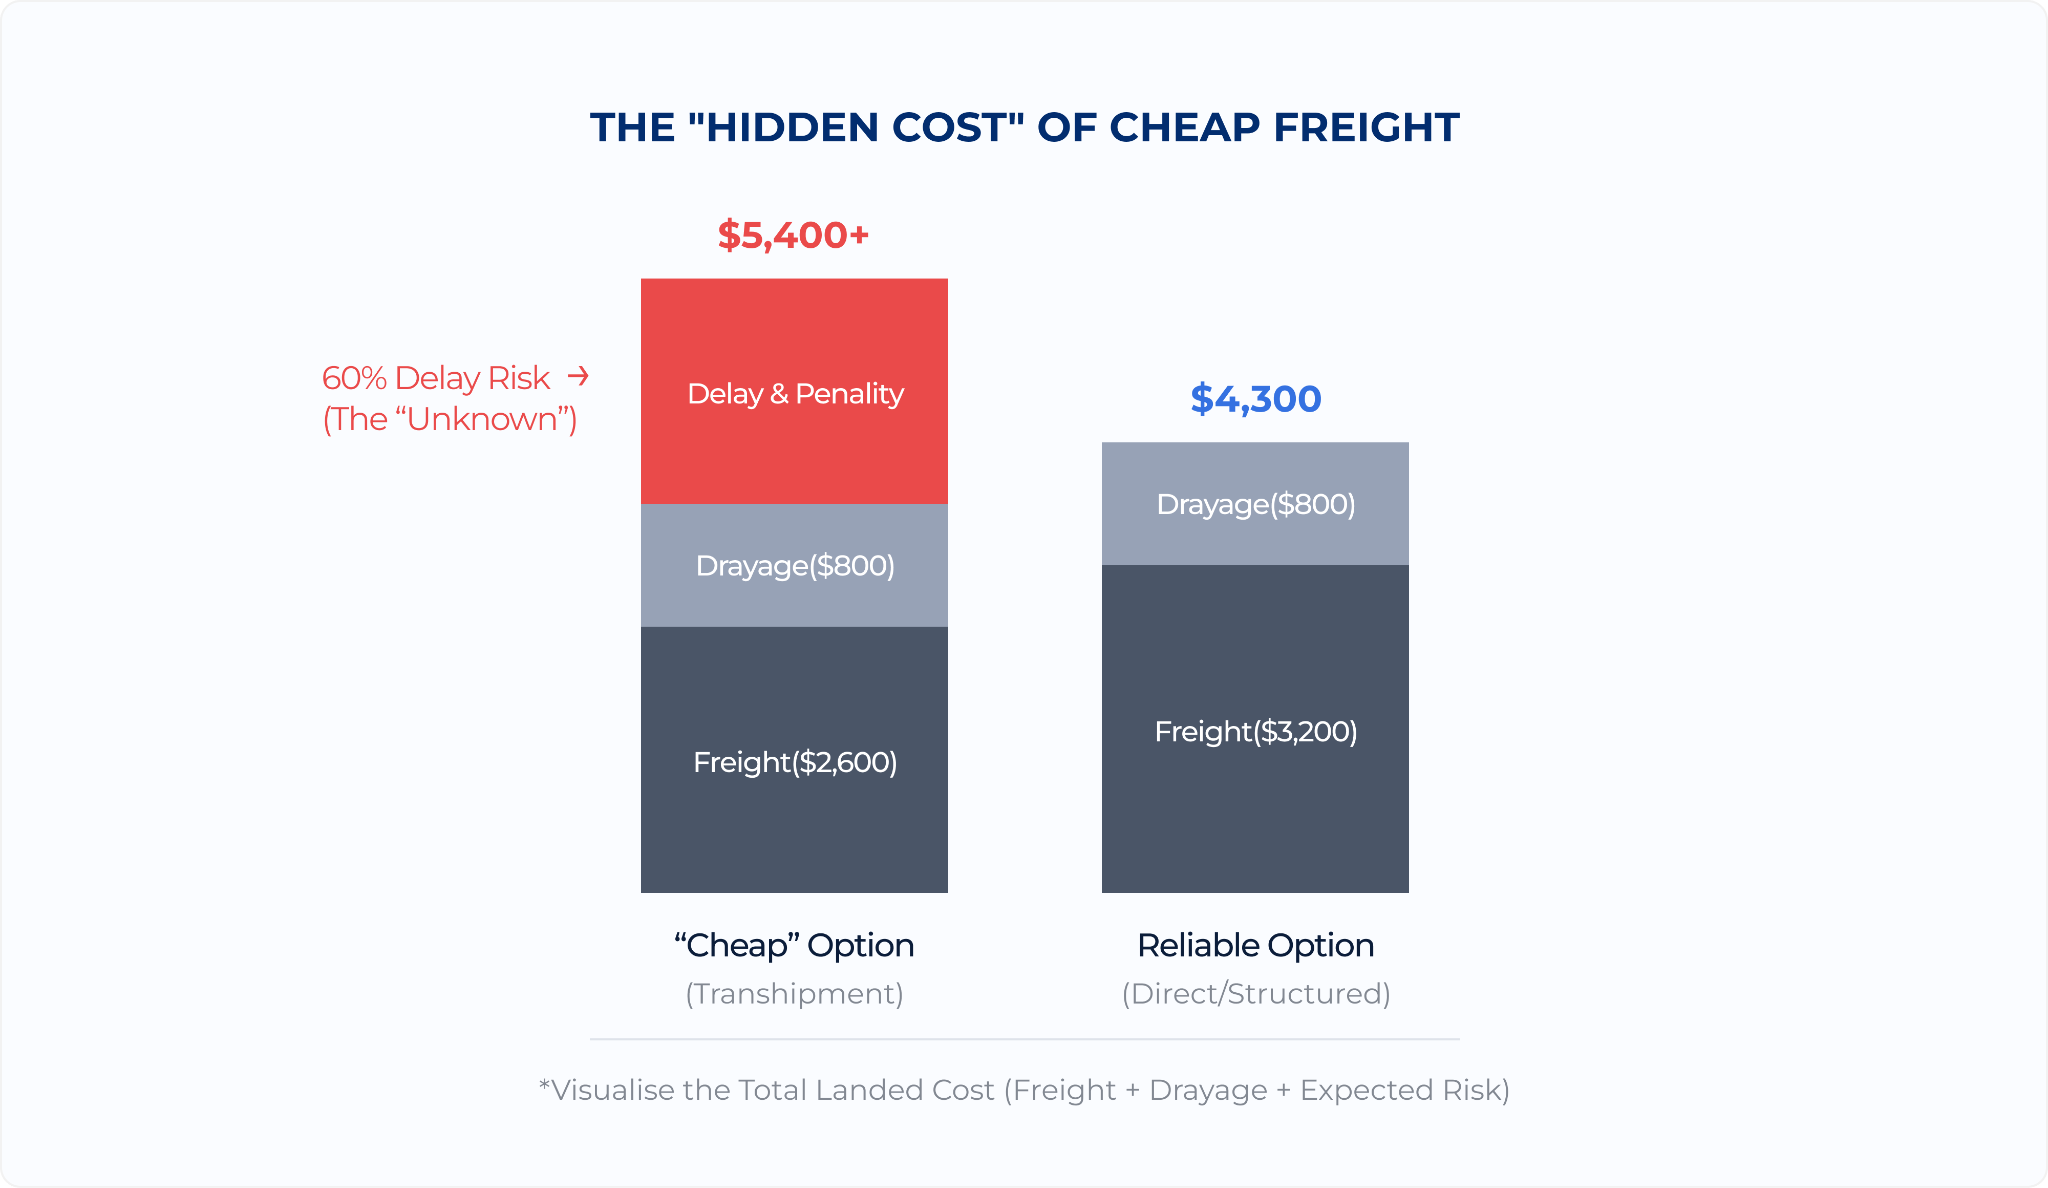
4. Total Landed Cost (Expected Value)
Illustrative example:
✔ Lower-Rate Service
Freight: $2,600
Drayage: $800
Expected delay probability (illustrative): 60–70%
Expected penalties + delay: $600–1,800
➡️ Expected total: $4,600–$5,400
✔ Higher-Reliability Service
Freight: $3,200
Drayage: $800
Delay probability (illustrative): 10–15%
➡️ Expected total: $4,100–$4,300
(Probabilities shown for expected-value illustration; replace with your lane’s 90-day performance.)
Case Study: Rajasthan Granite Importer
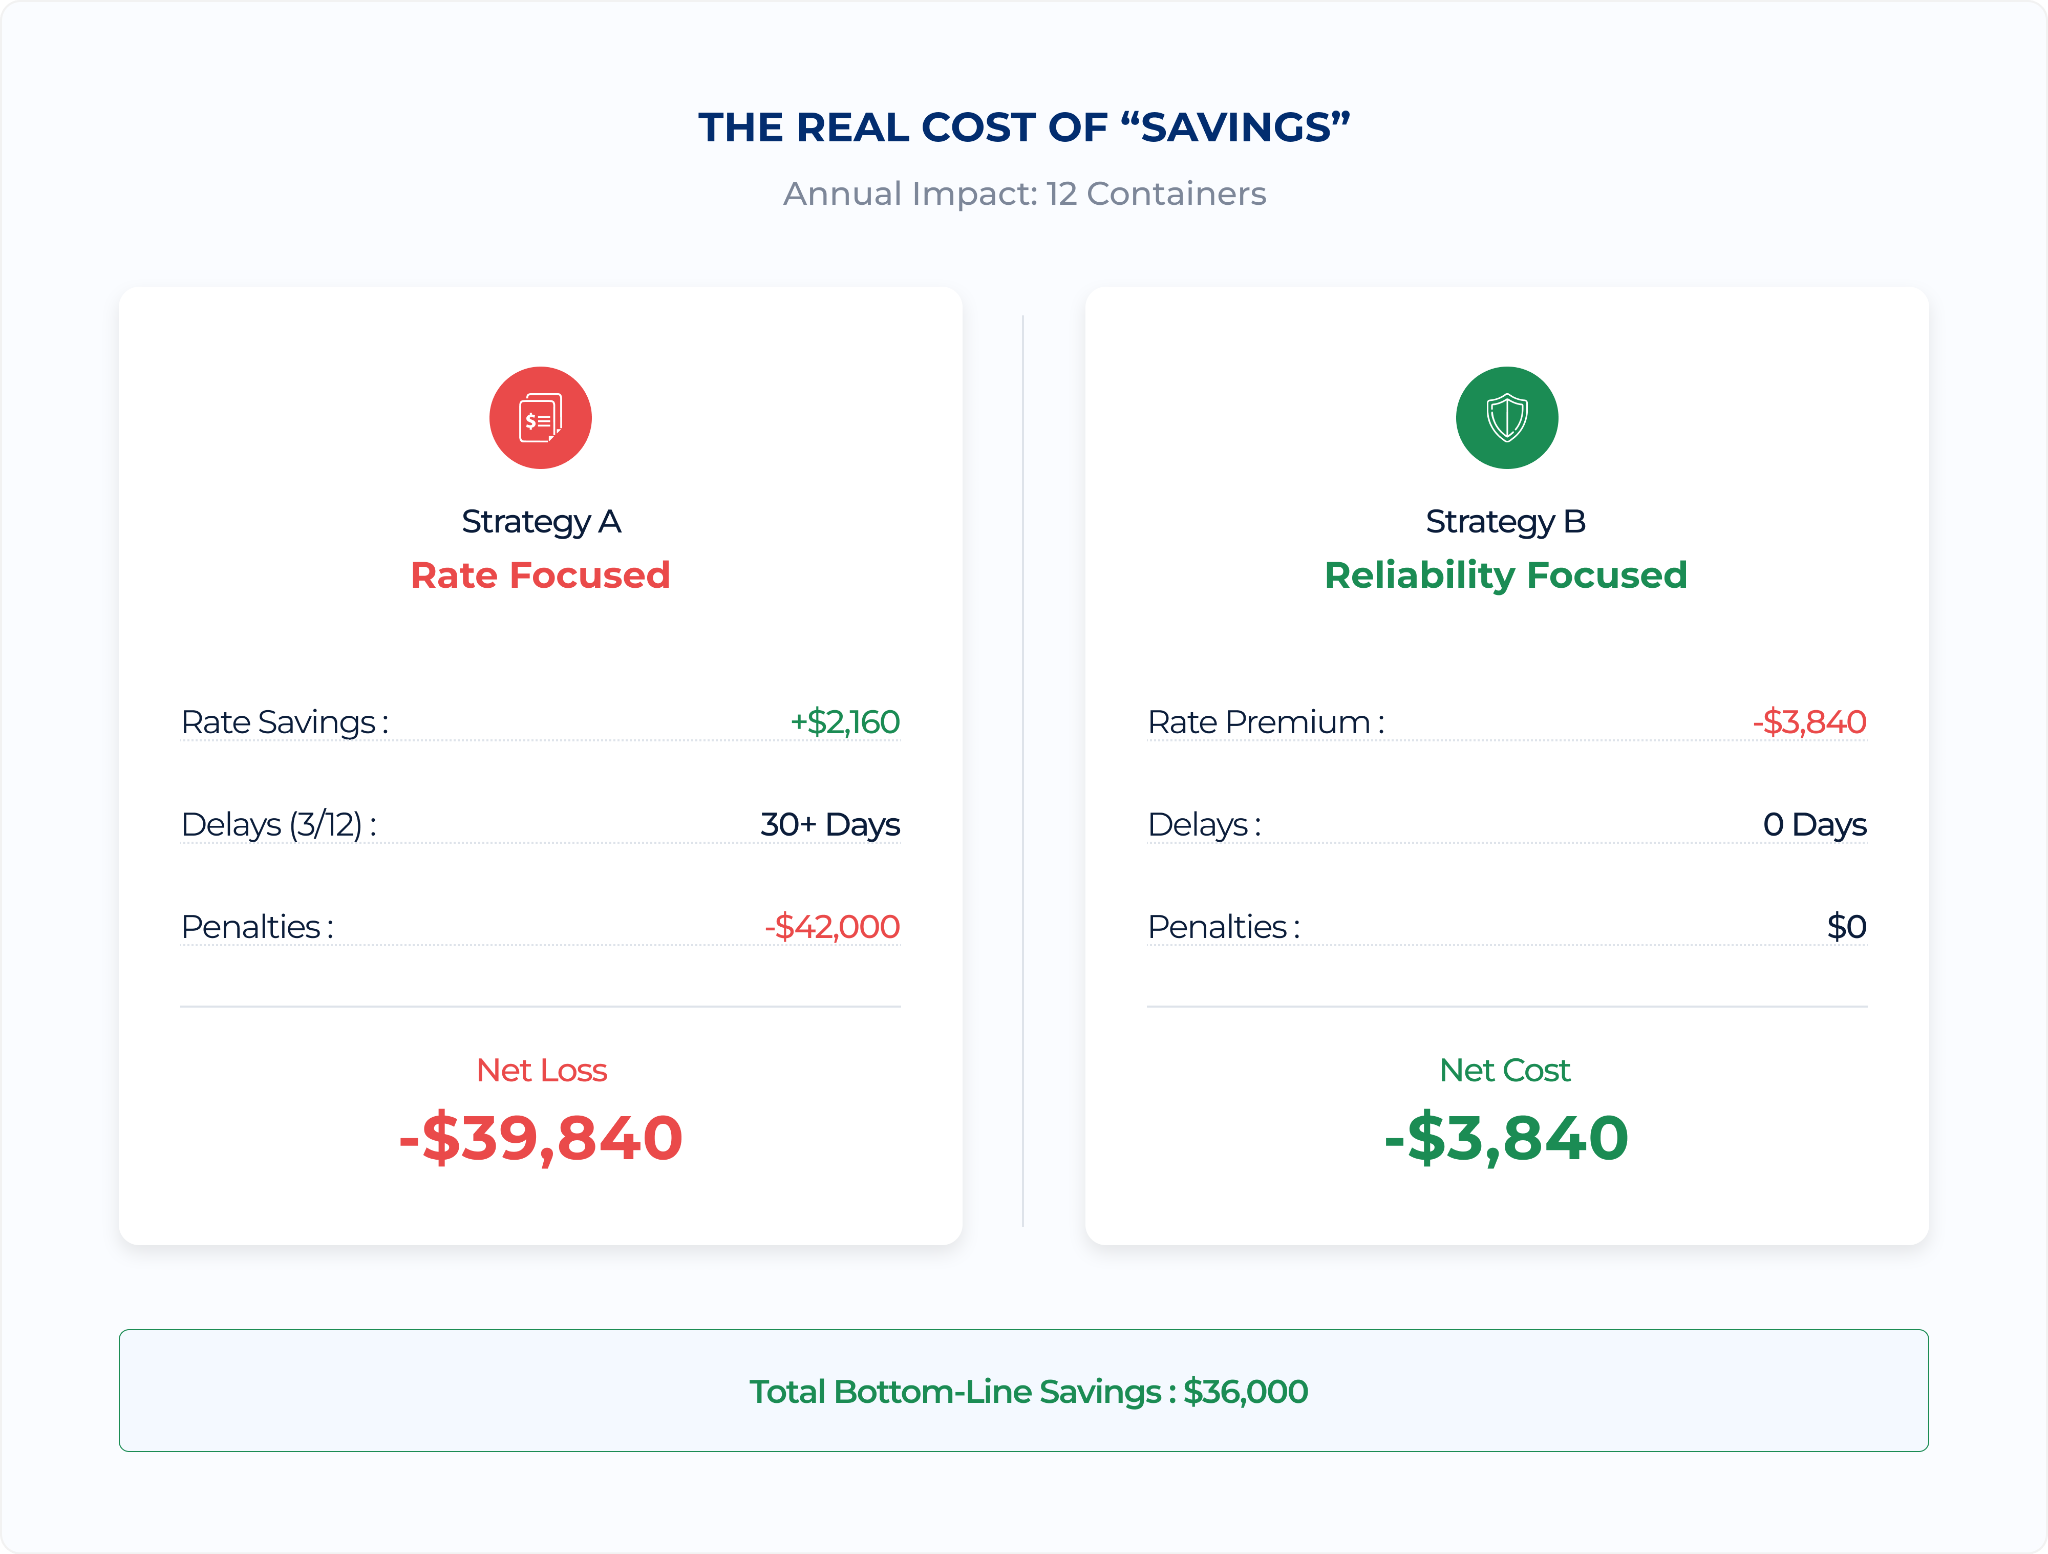
Before (rate-first):
~$180 saved per container
3/12 shipments delayed 10+ days
Customer penalties: $42,000
➡️ Net: –$39,840
After (risk-first):
~$320 extra per container
Zero delays
Zero penalties
➡️ Net: +$38,160
Outcome difference: $78,000 in one year.
Five Questions to Ask Before Booking
Is this routing direct or transshipment?
What is the lane’s 90-day on-time performance
How predictable is 20’ equipment/chassis availability?
What is the escalation and rebooking protocol?
What is my total landed cost—not just my freight rate?
If these answers aren’t clear, hidden risk is hiding in your shipment.
Airlift’s Approach: Reliability Before Rate
Airlift evaluates:
Route architecture
Equipment allocation depth
90-day lane reliability
Rate
Because for heavy cargo, a $500 savings can create a $15,000 penalty.
As Maersk CEO Vincent Clerc said in an earnings call (reported by JOC, Aug 2025):
“Any skeptics there might have been in the market about our ability to deliver the 90% schedule reliability are gone.”
Reliability is no longer optional. It is the new competitive advantage.
Our clients pay slightly more per container—but lose far less per year.
What This Means for You
If you ship granite, marble, steel, machinery, or project cargo:
Can your business absorb a 50% chance of delay?
If not, it’s time to shift from cheapest rate to lowest-risk routing.
The cheapest rate rarely produces the cheapest outcome.
Want to Understand Your Actual Risk Exposure?
Share your routing and cargo details.
Within 48 hours, you’ll receive:
Route risk assessment
90-day reliability comparison
Equipment availability insight
Expected-cost modeling

Sources
Executive Comments Part 3: Mediterranean Shipping Through Zim — Journal of Commerce, Jan 1998
Container Shipping Outlook: What to Expect in 2025 — Journal of Commerce, Dec 2024
Sea-Intelligence Maritime Analysis, Global Schedule Reliability (2024–2025)
Gemini Cooperation Holds Early Lead on Ocean Service Reliability — Journal of Commerce, Feb 2025
Rate Premiums Could Be in the Cards for Gemini Cooperation Customers — Journal of Commerce, Aug 2025
eeSea Ocean Visibility Analytics (Q1–Q3 2025)
Get a quote for your shipment
Have a shipment to move? Send the origin, the destination, the cargo and the container or weight; we reply with the rate, the routing and the services included.